Here is an example of grouped tabsets in Quarto created with the Tabby extension. Select Python to see both tabsets switch. The code is available on GitHub.
First tabset
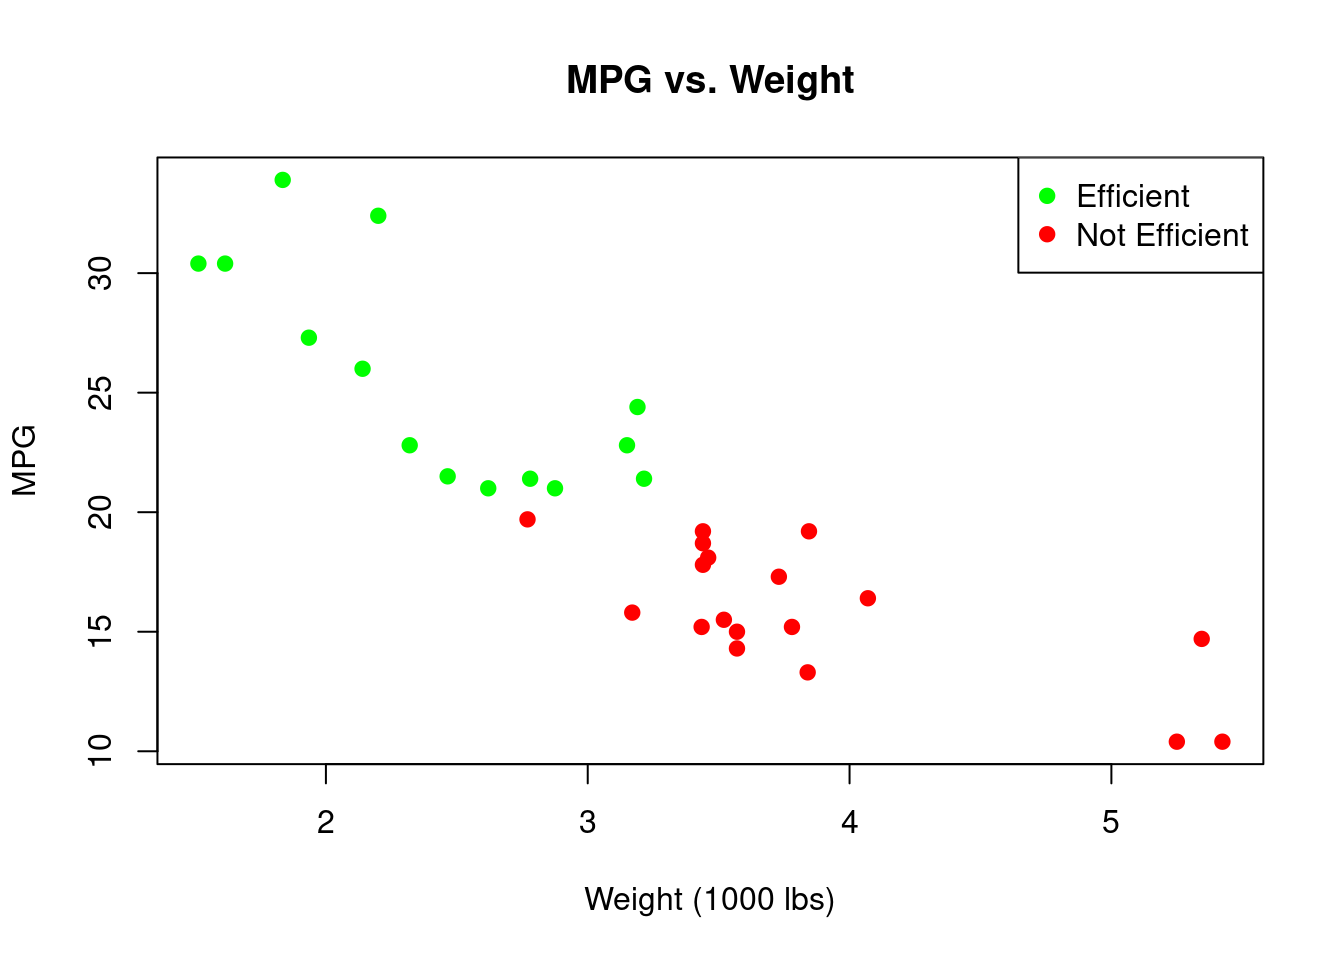
data("mtcars")
mtcars$fuel_efficiency <- ifelse(mtcars$mpg > 20, "Efficient", "Not Efficient")

plot(
  mtcars$wt, mtcars$mpg,
  main = "MPG vs. Weight",
  xlab = "Weight (1000 lbs)", ylab = "MPG",
  col = ifelse(mtcars$fuel_efficiency == "Efficient", "green", "red"), pch = 19
)

legend("topright", legend = c("Efficient", "Not Efficient"), col = c("green", "red"), pch = 19)
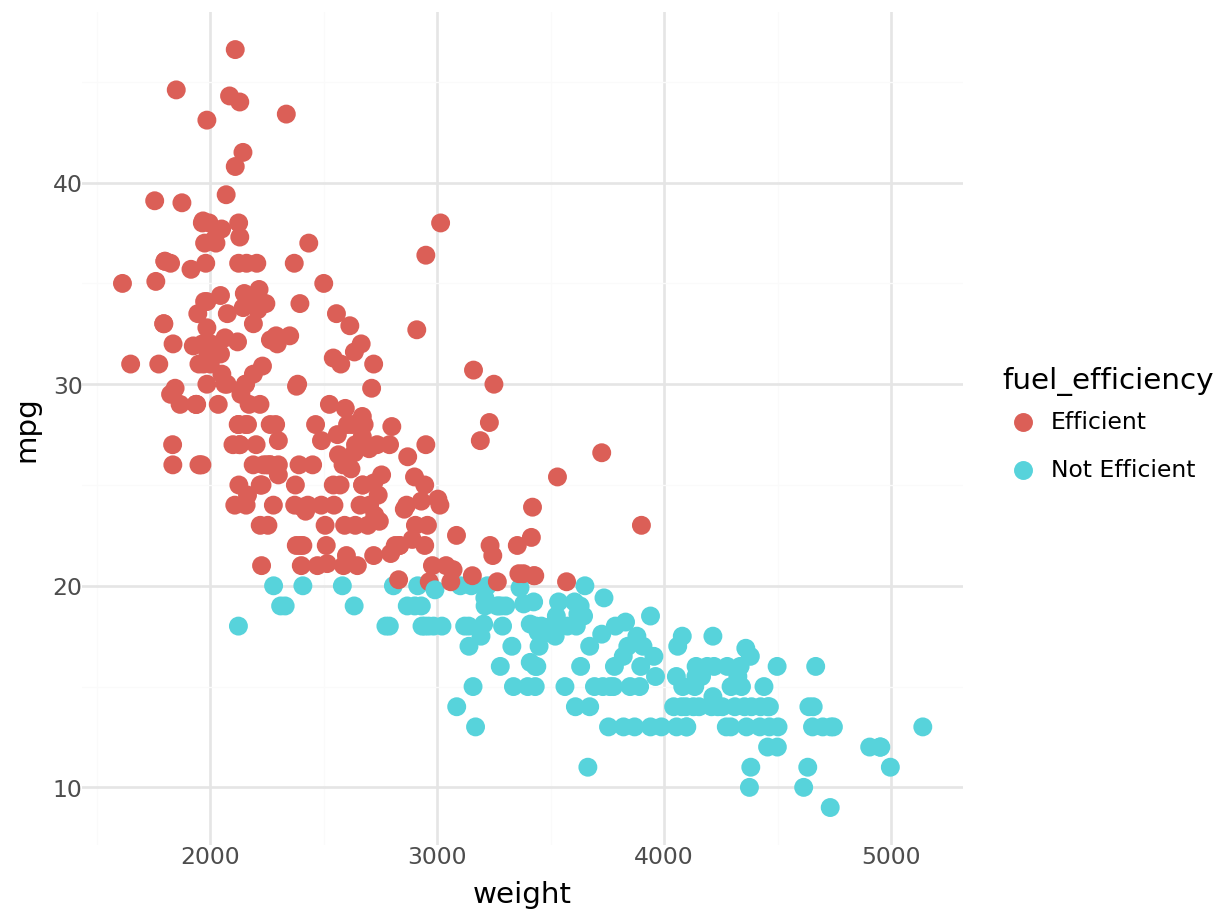
import pandas as pd
from plotnine import ggplot, aes, geom_point, theme_minimal

mtcars = pd.read_csv("https://raw.githubusercontent.com/mwaskom/seaborn-data/master/mpg.csv").dropna()
mtcars['fuel_efficiency'] = ['Efficient' if mpg > 20 else 'Not Efficient' for mpg in mtcars['mpg']]

plot = (
    ggplot(mtcars, aes(x='weight', y='mpg', color='fuel_efficiency')) +
    geom_point(size=3) +
    theme_minimal()
    )

plot.show()
Second tabset
library(gt)
towny <- gt::towny

towny_mini <- towny[order(-towny$density_2021), c("name", "website", "density_2021", "land_area_km2", "latitude", "longitude")]
towny_mini <- head(towny_mini, 10)

gt(towny_mini)
| Toronto |
https://www.toronto.ca |
4427.75 |
631.10 |
43.74167 |
-79.37333 |
| Brampton |
https://www.brampton.ca |
2468.99 |
265.89 |
43.68833 |
-79.76083 |
| Mississauga |
https://www.mississauga.ca |
2452.56 |
292.74 |
43.60000 |
-79.65000 |
| Newmarket |
https://newmarket.ca |
2284.21 |
38.50 |
44.05806 |
-79.45833 |
| Richmond Hill |
https://www.richmondhill.ca |
2004.39 |
100.79 |
43.87139 |
-79.43722 |
| Orangeville |
https://www.orangeville.ca |
1989.91 |
15.16 |
43.91528 |
-80.10861 |
| Ajax |
https://www.ajax.ca |
1900.75 |
66.64 |
43.85833 |
-79.03639 |
| Waterloo |
https://www.waterloo.ca |
1895.66 |
64.06 |
43.46667 |
-80.51667 |
| Kitchener |
https://www.kitchener.ca |
1877.68 |
136.81 |
43.41861 |
-80.47278 |
| Guelph |
https://guelph.ca |
1644.06 |
87.43 |
43.53583 |
-80.22889 |
from great_tables import GT, html
from great_tables.data import towny

towny_mini = (
    towny[["name", "website", "density_2021", "land_area_km2", "latitude", "longitude"]]
    .sort_values("density_2021", ascending=False)
    .head(10)
)

(
    GT(towny_mini)
)
| Toronto |
https://www.toronto.ca |
4427.75 |
631.1 |
43.741667 |
-79.373333 |
| Brampton |
https://www.brampton.ca |
2468.99 |
265.89 |
43.688333 |
-79.760833 |
| Mississauga |
https://www.mississauga.ca |
2452.56 |
292.74 |
43.6 |
-79.65 |
| Newmarket |
https://newmarket.ca |
2284.21 |
38.5 |
44.058056 |
-79.458333 |
| Richmond Hill |
https://www.richmondhill.ca |
2004.39 |
100.79 |
43.871389 |
-79.437222 |
| Orangeville |
https://www.orangeville.ca |
1989.91 |
15.16 |
43.915278 |
-80.108611 |
| Ajax |
https://www.ajax.ca |
1900.75 |
66.64 |
43.858333 |
-79.036389 |
| Waterloo |
https://www.waterloo.ca |
1895.66 |
64.06 |
43.466667 |
-80.516667 |
| Kitchener |
https://www.kitchener.ca |
1877.68 |
136.81 |
43.418611 |
-80.472778 |
| Guelph |
https://guelph.ca |
1644.06 |
87.43 |
43.535833 |
-80.228889 |